QuickStart Manual v1.4
Setting the Chart's Look
Setting the Chart's Data
Moving the Chart Around
Setting a KeyFrame
Animating Between data sets
Changing a KeyFrame
Previewing your Moves
Saving the Moves
Adding Textures
Rendering
About the Evaluation Version
About OpenGL
Registering MovingChart

Overview
The Big Picture
MovingChart is a tool for editors to add high-quality 3D charts and graphs directly to your show. You can easily animate the data, as well as the chart itself in full three dimensions.
The Parts of the Screen
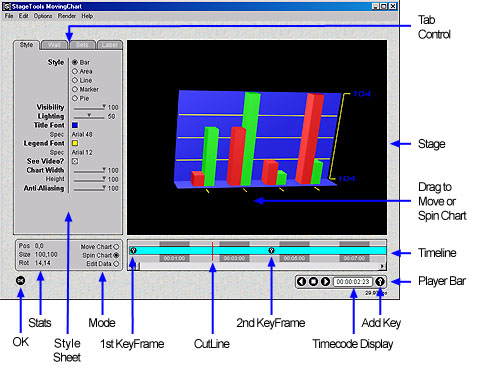
The Stage shows the current chart being created, as well as the spreadsheet-like data entry page. The Style sheets, controlled by the Tab Control, allow you to customize the look of the chart.
The Timeline sits on the bottom of the screen and provides a way to set the timings of the chart as the move across the screen, or data changes over time. The concept is similar to that used by most nonlinear editing systems.
Below the Timeline the Player bar, which mimics a VCR control panel, is used to play animated scenes on the Stage. The "key" icon to the right of the timecode display adds new KeyFrames to the timeline.
In a Nutshell
- The basic idea of MovingChart is to use the controls on the tabbed Style Sheets to set how you want your chart to look.
- Change the defaults until the chart looks the way you want.
- Replace the default data by clicking on the Mode button and Edit Data to graph using the spreadsheet.
- Setting the Mode button to Spin Chart or Move Chart and drag the chart into the position you want to begin the scene at.
- Click on the Add Key button to set that position in the 1st KeyFrame.
- Click on the Timeline to select where you want the first move to end.
- Move the chart to the next position you want to move to.
- Click on the Add Key button to set that position in the 2ndt KeyFrame.
- Clicking on the Player Bar controls to play your move.
About KeyFrames
A KeyFrame is a "snapshot in time" of the chart’s position and size. MovingChart uses KeyFrames to move from one view to another without having to define all the in-between positions by hand.
You simply need to define two KeyFrame positions, and the chart will move from the first to the second position over the course of time you have defined.
The first KeyFrame is already defined for you (you have to start from somewhere), but you can easily change it to where you really want to start.
The manipulating of KeyFrames is done both in the Stage and the Timeline. The actual positioning of the chart done in the Stage (and the Style Sheets) , while the timing is established on the Timeline.
The look of the chart is controlled by changing the settings on the four Style Sheets. You can switch from page to page by clicking on the Tabs at the top of the pages. As you change one of the settings, the chart will instantly reflect that setting, making it easy to play around and see the effects of any changes/
Most of these properties are not animatable, with the exception of the size and data set (for animating between up to 4 sets of data), so they remain static for the entire scene once set.
Style
The Style page controls the overall look of the chart. Most of the options are self explanatory, but more details are provided below on some of them:
Lighting
Moving the slider will set the way the chart is lit, from no lighting at '0' to fully 3D lighting with Phong-shaded specular highlights at '100'.See Underlying Video
This will show the video from your underlying clip on your NLE's timeline (placeholder clip) as a background to the chart. You can choose a background using the Load Background option in the File menu, or use whatever video is in the placeholder clip.Size -- Animatable!
The Height and Width sliders will control how big the chart will appear on the screen.Anti-Aliasing
This slider controls the degree of ant-aliasing used to draw the chart. Anti-aliasing removes the "jaggies" from the edges, which takes more time to render. You can preview the chart without anti-aliasing by Setting the "Draw Chart Fast" option from the "Options" menu will sacrifice image quality for speed, by turning off Anti-Aliasing when showing the chart on the screen (but not when it's finally rendered) .Grids
The Grids page contains options to set which walls are being displayed, as well as the number and colors of grid and tick lines.
Sets
The Sets page contains options on how the data itself is drawn. You can stack the data or have each data set displayed individually, set the width and depth of the elements and control which of the four data sets (or all) is displayed. The minimum and maximum values that are displayed can also be changed here.
Clicking on the Animate check-box will allow you to animate the data from one data set to another. See the Animating Between data sets for more information
Text
The Text page contains options on how the various text elements drawn.
Here you set the font size, color of the font used to display the values of the chart. You can also set the number of decimal places to show. The prefix and suffix boxes allow you to add text before and after the actual values displayed at the top and bottom. You can also set font size, color of the font used to display the legend and title of the chart.
You can set the data into MovingChart 3 ways: Loading a text file that contains the data, copying a section of a spreadsheet to the Clipboard, and finally, by typing it in manually.
Loading Data from a File
Choosing the Load Data from File option in the File menu will allow you to load a text file containing the data. Each data row contains the data elements (up to five, including the label). Each element should be separated by a TAB and each line separated by a CR or LF or both. Most spreadsheet programs such as Microsoft's Excel create data in this format when saved as "Text."
You can choose where in MovingChart's data editor to load the data by clicking on the top-right cell you want to begin from. The column and row labels will appear in color indicating the starting point. If you are not in the data editor when you load, the data will be loaded starting at the top-left most cell (which includes the data and set labels).
Loading Data from The Clipboard
Choosing the Load Data from Clipboard option in the File menu will allow you to load the current contents of the computer's Clipboard into MovingPicture from a spreadsheet or other program. Choose the placement in the same way as when loading from a file.
Typing Data by Hand
Clicking on the Edit Data to in the Mode area will fill the stage area into a spreadsheet-like screen for editing the data to be graphed. You can also load a tab-delimited file by choosing the Load Data File option from the File menu.
Chart Title
The top-left corner box contains the title you want to show in the chart, if any.Set Labels
The top row contains the labels you want to use to display for each data set, if any.Data Row Labels
The top row contains the labels you want to use to display for each data row, if any.Data Area
The internal area holds the data elements for the chart.
The Mode radio buttons under the Style Sheet area controls whether you are moving the chart, or spinning and/or tilting it. You can set these positions by clicking on the Add Key button next to the Player Bar. This will add a KeyFrame to the timeline (or change the one that may already be there), and be one of the positions the charts animated to.
Moving the Chart
If the Move Chart radio button is selected, dragging the chart with the mouse will cause it to move where you've dragged it. If you run out of "mousing room", you can repeat this action until the chart is where you want it to be.
Spinning and /or Tilting the Chart
If the Spin Chart radio button is selected, dragging the chart with the mouse will cause it to spin from -90 to 90 degrees as you move the mouse left to right. Moving the mouse top to bottom will cause the chart to tilt from 0-90 degrees.
Sizing the Chart
The size of the chart is set by moving the Height and Width sliders on the first Style sheet page. The range is from 50 to 100%, but you can set the values numerically for other scalings.
NOTE: You can set the position, tilt and spin values numerically, to any number by right-clicking on the KeyFrame once it's set. Click here for more information. This is particularly useful in setting multiple revolution spins (i.e. > 360 degrees).
The Camera already has it’s has its initial position KeyFrame already added at the first frame of where it appears in the Scene. This first KeyFrame can be easily reset to reflect where you want the motion to start.
Making a new KeyFrame involves three steps in this order:
- Choose the frame in the Timeline where the KeyFrame should appear.
- Position the chart into the position and size you want.
- Click on the Add Key button (it looks like a key within a circle) in the Player Bar.
A new KeyFrame will be added to the Timeline, containing the current state of the chart, and the position in the timeline is advanced by one second for the next KeyFrame you may wish to add.
Holds
If there is no change in the chart’s position, size or rotation from the previous KeyFrame, a "Hold" message will appear between the two positions.
Changing an existing KeyFrame
If there was already a KeyFrame at that frame (indicated by the red icon on the Timeline), when you click the "Add Key" Viewer button, it will be update with any changes you have made to the Camera framing. At any given frame, there will be only one KeyFrame.
MovingChart will automatically figure out the in-between positions between this KeyFrame and the one that preceded it.
Scrubbing the Timeline
Dragging the cursor in the Timeline area will cause the position to "scrub" (i.e. the chart image in the Stage moves with the cursor as you drag it). To scrub, click the mouse in a clear area of the Timeline that does not contain a KeyFrame. As you move the cursor left to right, the Stage will show the motion for that frame.
You can animate actual data values as easily as you can move or spin the chart. MovingChart can animate between four sets of data, so put the values you want to animate to and from in the data sets.
Click on the Animate Data? check box in the Sets Style Sheet. Highlight the first KeyFrame, and choose what set you want to start with by clicking on it's radio box. Clicking on the Add Key button next to the Player Bar to select that set.
For each other set you want to animate the data to, select a time on the timeline, choose a set and add the KeyFrame.
The color of the data will be drawn in the first set's color.
Changing the Size, Spin, Tilt or Position
Simply click on the KeyFrame icon on the Timeline and then reposition, spin, tilt or size the chart. When it is in the new position, click on the Add Key button (the one with the key icon on it) to reset the KeyFrame to the new positions. The key icon on the timeline will turn red when you are within 4 frames of it, indicating you are in-range to change it. (Hitting the [ENTER] key will do the same thing as click on the Add Key button)
Changing the Time
You can move the time when any KeyFrame (except the first one) becomes active by dragging its icon in the Timeline to where you want it to go.
Eases
The default ease is for the moves to slow in and then out. You can change the slow ease of any particular KeyFrame. Right-clicking (or Control-clicking on Macintosh systems) on a KeyFrame in the timeline will bring up a dialog box that will allow you to control how the move will flow from that key to the next.
There are also boxes in the dialog that will let you numerically set the position and size. This is useful when trying to position the chart off screen, spin multiple revolutions or some other particular place or size.
Removing a KeyFrame
You must first select the KeyFrame on the Timeline you want to remove (it will turn red), and hit the Delete key on the keyboard.
Cut and Paste of KeyFrames
The "Edit" menu contains the standard options for Cutting, Pasting and Copying the positional information of the currently highlighted KeyFrame (the red one). There are also 32 levels of Undo/Redo. When pasting a KeyFrame and there is no KeyFrame highlighted, a new one will be added to the timeline at the current frame position.
TV Safe Area Boxes
Clicking on the "Show TV Safe" option in the "Options" menu will draw a square box on the viewer screen, showing the Safe Action area. Within that box is a rounded corner box that defines the Safe Title area. These boxes will not appear in the rendered video.
The Player Bar contains VCR-like controls to play whatever moves you have set up in it's window. The moves will play in real-time, but will drop frames if it cannot render it fast enough.
Setting the "Draw Chart Fast" option from the "Options" menu will sacrifice image quality for speed, by turning off Anti-Aliasing when showing the chart on the screen (but not when it's finally rendered) .
If a move is playing, clicking on the Timeline will cause it to play from the point in time you clicked. Clicking outside the Timeline will stop playing.
Scrubbing the Timeline
Dragging the cursor in the Timeline area will cause the position to "scrub" (i.e. the Viewer frame moves with the cursor as you drag it). To scrub, click the mouse in a clear area of the Timeline that does not contain a KeyFrame. As you move the cursor left to right, the Viewer will show the motion for that frame.